- D
A
T
A - MODEL
- I
N
F
O - O
T
H
E
R


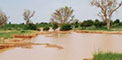
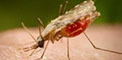


 Malaria in West Africa under Current and Future Climate
Include search box, map type and zoom level.
Display the year which the current heatmap overlay corresponds to and the relevant data of the clicked location
Display the range of variabls for the current heatmap overlay.
Modify the opacity of the heatmap overlay or change the speed of animation
Select a variable for data visualization
Click on the map to view the temporal variation data for a particular location
Choose a visualization type: temporal pattern or time series
Description of the underlying HYDREMATS model
Information about this web application and the research team
Assumptions and limitations for the HYDREMATS model

